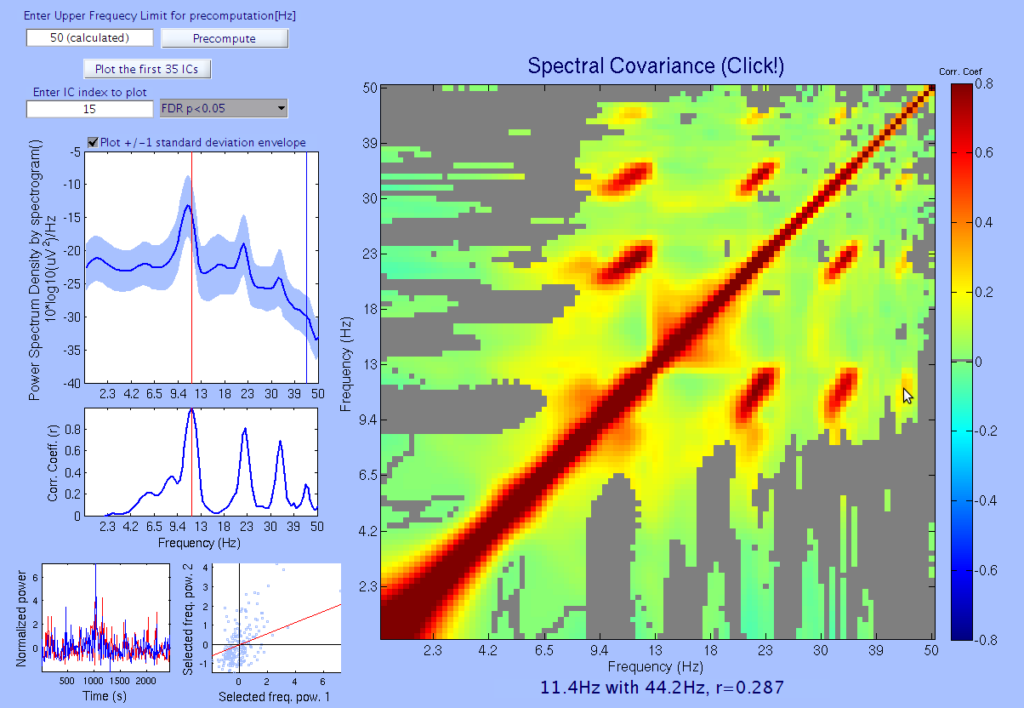
The first author Nattapong visited me at the Swartz Center in UCSD a few years ago. At that time, I was fascinated by re-inventing (without knowing, of course) the idea of comodugram/comodulogram, which is a visualization of cross-frequency power-power coupling (also called spectral covariance). I suggested the publication of this idea to Nattapong, and he agreed. Then the idea was published.
Journal page
https://www.mdpi.com/1424-8220/20/24/7040/htm
EEGLAB plugin Wiki page
https://github.com/sccn/PowPowCAT

Sometimes you see two peaks in power spectral density (PSD) of EEG signals. But have you seen four peaks!? The owner of this brain is a grad student in our lab.
This comodulogram has been probably most frequently used in Buzsáki lab in the field that is closest to mine. In fact, Nattapong and I wrote them to ask about it. They were so kind, György pointed us to several of his colleagues and they told us several interesting things about this method.
Initially, I did not even know the name of this visualization. I asked it to a couple of smart people, but no one knew it. Later, Nattapong and I learned that it is called ‘comodugram’. But I did not like the name. The other, slightly less common name ‘comodulogram’ sounds better. But I like the fully descriptive version of the name, Power-Power Coupling Analysis Tool (PowPowCAT). Actually, I would be motivated to publish any computational tool that has the name as nice as PowPowCAT.
